Dashboard
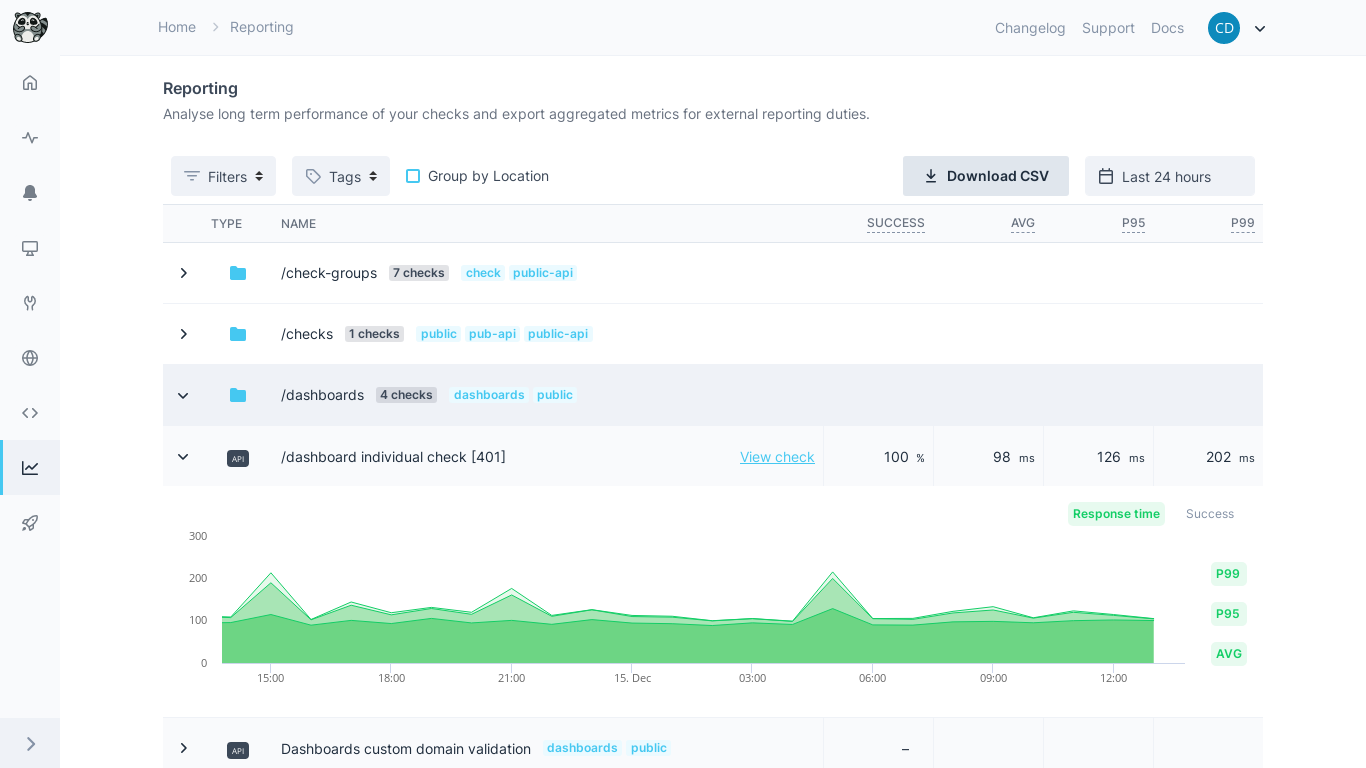
With the reporting dashboard, you can get an overview of all your checks, including average, p95, and p99, response times, as well as the success ratio and more. You can also export this data to a CSV for further processing by any other tools.
Overview
When navigating to the reporting dashboard, you will see an overview screen with a list of your first 15 checks.
Here you can use the toolbar to filter / sort by the following metrics:
- Date Range
- Check Type
- Check Tags
- Check Group Tags
- Name (ASC / DESC)
- Check Type (ASC / DESC)

Graphs
Clicking on a check will open a graph of the response times and success ratio. These graphs are tied to the date range selected in the toolbar above.
The graph x-axis granularity will be adjusted according to the size of the data range that you selected using the date picker, as follows:
- Up to two weeks, data will be grouped hourly.
- Up to 6 months, data will be grouped daily.
- Up to 24 months, data will be grouped weekly.
- Up to 48 months, data will be grouped monthly.
- From that point onwards, data will be grouped yearly.
In the response time graph, all three metrics (average, p95, p99) are shown by default. However, you can individually toggle these on and off by clicking on the pills with their respective names to the right of the graph.

CSV Export
In the reporting overview, you can export all available statistics to a CSV. Select the date range for which you’d like to export statistics, and then click Download as CSV on the right side of the toolbar. The generated CSV file will include the following columns/fields:
- Name
- Check ID
- Check Type
- Success Ratio
- Response Time (
Average) - Response Time (
P95) - Response Time (
P99) - Check Tags
Remember these statistics, like success ratio and response times, are calculated based upon the selected date range. By default, this is set to “Last 24 Hours”.
Last updated on August 30, 2024. You can contribute to this documentation by editing this page on Github